Mapping Your Organizational Codebase for Evaluation
Before you can evaluate a GraphRAG system on your code, you need to understand your codebase as a system.
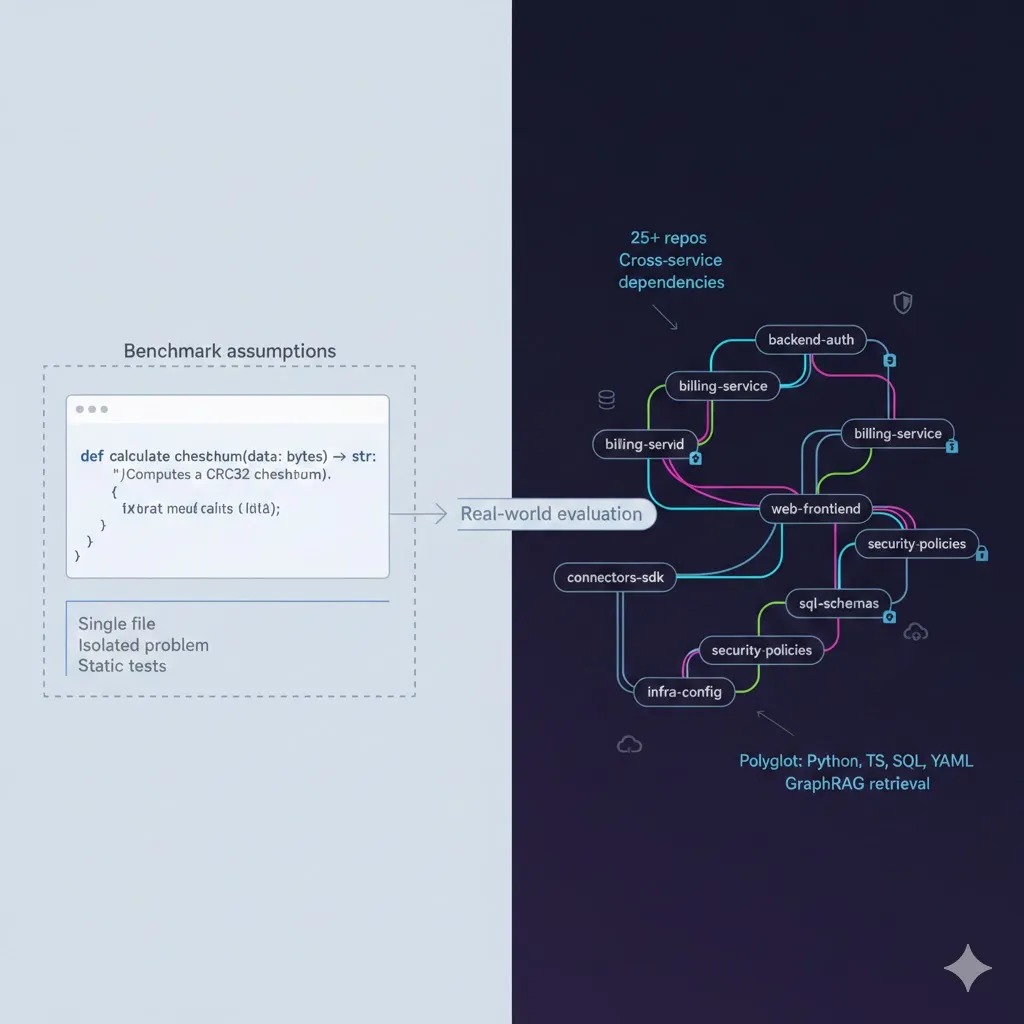
If you’re working with 20–30 repositories, each owned by different teams and evolving at different speeds, “the codebase” is really an ecosystem: services, frontends, connectors, schemas, security layers, and infrastructure all woven together.
This post walks through how to map that ecosystem so you can design meaningful evaluation datasets for your cross-repository assistant.
Why Mapping Comes Before Evaluation
Most evaluation failures trace back to one root cause: the evaluation dataset doesn’t reflect how your system is actually used.
If you randomly sample files or pick a few issues from one repository, you’ll get:
- Single-repo, single-file questions.
- Little to no cross-service reasoning.
- Very little stress on retrieval.
But in reality, your developers ask things like:
- “If I change this user field, what breaks?”
- “Where is authentication actually enforced?”
- “Why did we change this integration last quarter?”
Answering those questions requires cross-repository retrieval, version awareness, and graph traversal. To build an evaluation set that reflects this, you first need a map: a dependency graph of your organizational codebase and the queries developers actually care about.
Step 1: Build a Repository Dependency Graph
Start by extracting how your repositories depend on each other. At a minimum, you want to capture:
- Imports between modules and shared libraries.
- API calls between services (HTTP, RPC, GraphQL, gRPC, messaging).
- Schema references (tables, columns, migrations).
- Configuration references (shared config keys, feature flags, secrets).
Conceptually, you’re building a graph where:
- Nodes = repositories, services, schemas, key modules.
- Edges = “calls”, “imports”, “references”, “configured by”.
Here’s a simplified pseudocode sketch for Python repos:
from pathlib import Path
import ast
import json

def extract_cross_repo_dependencies(repo_root: Path) -> dict:
    """
    Extract imports, API calls, and configuration references
    that cross repository boundaries.
    """
    dependencies = {
        "imports": [],           # Direct code imports
        "api_calls": [],         # HTTP/RPC calls to other services
        "schema_references": [], # Database table/column references
        "config_references": []  # Shared configuration keys
    }

    for py_file in repo_root.rglob("*.py"):
        tree = ast.parse(py_file.read_text())
        # Extract import statements
        # Identify API client instantiations
        # Find SQL query strings
        # Locate config key accesses

    return dependencies
In a full implementation, you would:
- Parse import statements and map them to other internal packages/repos.
- Look for HTTP/RPC clients (e.g.,
requests,httpx, gRPC stubs) and extract target service names/URLs. - Identify SQL strings and extract referenced tables/columns.
- Track access to config modules (e.g.,
settings["PAYMENTS_API_URL"]).
Normalize these into a graph format (e.g., JSON, Neo4j, NetworkX) so you can query:
- “Which repos depend on
user-service?” - “Which services hit the
paymentsdatabase?” - “What calls flow through
auth-middleware?”
Step 2: Classify Repositories by Role
Once you can see edges, group repos by the role they play. For a typical 25-repository setup, you might see something like:
| Repository Type | Count | Cross-Repo Dependency Pattern |
|---|---|---|
| Backend Services | ~8 | Import connectors, call other backends, reference SQL schemas |
| Frontend Apps | ~4 | Call backend APIs, share component libraries |
| Connectors/SDKs | ~5 | Imported by backends and frontends |
| SQL/Migrations | ~3 | Referenced by backends, define data contracts |
| Security/Auth | ~2 | Wrapped around or injected into all service calls |
| Infrastructure | ~3 | Configure deployment, routing, and environment for all of the above |
This classification helps you:
- Understand which repos are sources of truth (e.g., schemas, auth).
- See where contract boundaries live (APIs, types, connectors).
- Identify central hubs that many others depend on.
These roles will later drive your query types and evaluation focus areas.
Step 3: Mine Real Developer Questions
Next, you need to understand what developers actually ask when they’re stuck.
Useful sources:
- Slack / Teams channels
#help-backend,#help-frontend,#incidents,#oncall- Look for threads where someone asks a question and multiple services/repos get discussed.
- Code review comments
- “Where else is this called?”
- “Does this break X integration?”
- “Is this consistent with the schema in Y?”
- Onboarding docs and FAQs
- “How does authentication work end-to-end?”
- “How does the billing pipeline operate?”
- Incident post-mortems
- “What caused this outage?”
- “Which services were impacted and why?”
For each question you collect, note:
- Which repositories were referenced in the answer.
- Whether the resolution required:
- Following a dependency chain.
- Understanding a shared concept across multiple repos.
- Looking at historical changes (commits, PRs).
This corpus of real questions is the raw material for your evaluation query taxonomy.
Step 4: Define Evaluation-Relevant Query Types
From those real questions and your dependency graph, you can define a few core query types that your GraphRAG system must handle. Here’s a practical taxonomy:
Type A: Single-Repository, Multi-File
“How does the payment processing work in the billing service?”
Characteristics:
- Stays within one repository, but:
- Spans multiple modules (e.g., handlers, services, domain logic).
- May involve config, models, and background jobs.
- Requires:
- Retrieval across roughly 5–15 files.
- Local reasoning about control flow and data flow.
Use cases:
- Service onboarding.
- Understanding how a specific feature works end-to-end within a single codebase.
Type B: Cross-Repository, Single Concept
“How is user authentication implemented across the system?”
Characteristics:
- Focuses on one concept (
User,Auth,Session) that appears in many repos:- Auth backend.
- Frontend session management.
- Database user tables.
- Security middleware / gateways.
- Requires:
- Retrieval from multiple repositories.
- Entity resolution: understanding that
Customer,Account, andUsermay be related. - Producing a coherent concept-level explanation.
Use cases:
- Security reviews.
- Cross-service feature design.
- Architecture documentation.
Type C: Cross-Repository, Dependency Chain
“If I change the
Userschema, what services are affected?”
Characteristics:
- Starts at one artifact (e.g., SQL schema) and fans out across dependent systems:
- SQL schema → backend ORMs/models → API contracts → frontend types → connectors/SDKs.
- Requires:
- Multi-hop graph traversal over your dependency graph.
- Identifying indirect impact (e.g., a connector used by three services).
Use cases:
- Change impact analysis.
- Migration planning.
- Safe refactoring at scale.
Type D: Cross-Repository, Temporal
“Why did we change the payment flow in Q3?”
Characteristics:
- Spans time as well as repositories:
- Requires looking at Git history, PR descriptions, commit messages.
- Often involves documentation updates and incident reports.
- Requires:
- Retrieval conditioned on time windows (e.g., Q3).
- Linking code changes to narrative artifacts (docs, post-mortems, RFCs).
Use cases:
- Post-mortems.
- Architectural decision tracking.
- Audits and compliance.
These four types should cover a large portion of the high-value questions developers ask in a 25-repo environment.
Step 5: Identify Evaluation-Critical Code Regions
Not all code is equally important to evaluate. Some files are essentially “leaf” nodes; others are central arteries.
Focus your evaluation on three kinds of hotspots:
1. High-Connectivity Nodes
These are files or modules that many others depend on:
- Files imported by 10+ other files across repositories.
- API endpoints called by multiple consumers (backends, frontends, connectors).
- Shared type definitions and DTOs used in contracts.
Why they matter:
- Any retrieval failure here cascades.
- These are natural choke points for bugs, regressions, and integration issues.
- Evaluating your system on questions involving these nodes stresses its ability to navigate dense parts of the graph.
2. Recent Change Hotspots
Look at your Git history over the last six months:
- Files with high commit frequency.
- Areas with many PR comments or reverts.
- Code associated with recent incidents or “hot” features.
Why they matter:
- This is where developers currently spend time and make changes.
- Evaluation on these areas tests:
- Version awareness (has the system “seen” the new patterns?).
- Robustness to churn (can it reason even as files evolve?).
3. Architectural Boundaries
These define how different parts of the system talk to each other:
- Service-to-service communication layers.
- Database access layers / repositories.
- Authentication and authorization checks.
- Gateways, API edges, and public interfaces.
Why they matter:
- Cross-repository retrieval is most critical at boundaries.
- Many developer questions are really about “what crosses this boundary and how?”
These regions should be overrepresented in your evaluation dataset. That’s where a GraphRAG system either shines or fails.
Step 6: Produce Concrete Evaluation Artifacts
By the end of this mapping process, you should have three key deliverables.
Repository Dependency Graph (Visualized)
- A graph view (e.g., in Neo4j, Graphviz, or a custom dashboard) that shows:
- Repos as nodes.
- Edges for imports, API calls, schema references, config dependencies.
- Ability to click on a node and see its inbound/outbound dependencies.
- A graph view (e.g., in Neo4j, Graphviz, or a custom dashboard) that shows:
Query Pattern Taxonomy with Real Examples
- A catalog of questions grouped into:
- Type A: Single-repo, multi-file.
- Type B: Cross-repo, single concept.
- Type C: Cross-repo, dependency chain.
- Type D: Cross-repo, temporal.
- For each type:
- At least 5–10 real examples from your Slack/code reviews/incidents.
- The set of repos and file types involved.
- A catalog of questions grouped into:
Priority File List for Evaluation Dataset Construction
- A ranked list of:
- High-connectivity files/modules.
- Recent change hotspots.
- Boundary/contract layers.
- For each file or module:
- Why it’s important.
- Example questions it participates in.
- A ranked list of:
These artifacts give you a data-backed foundation for building evaluation datasets that truly reflect your organization’s complexity—and for measuring whether your GraphRAG system is genuinely helping developers navigate it.
By mapping your organizational codebase this way, you turn “25 random repositories” into a coherent graph of roles, dependencies, and real-world queries. Only then can your evaluation meaningfully test what matters: cross-repository retrieval, relationship traversal, version coherence, and grounded generation.