End to End Evaluation for GraphRAG Systems That Solve Cross Repository Problems
This post shows how to run end to end evaluation for a GraphRAG system and how to read the results so you can improve the system. If your work involves resolving cross repository questions across many repos, this is for you. I will use plain language, code you can copy, and actionable insights you can apply right away.
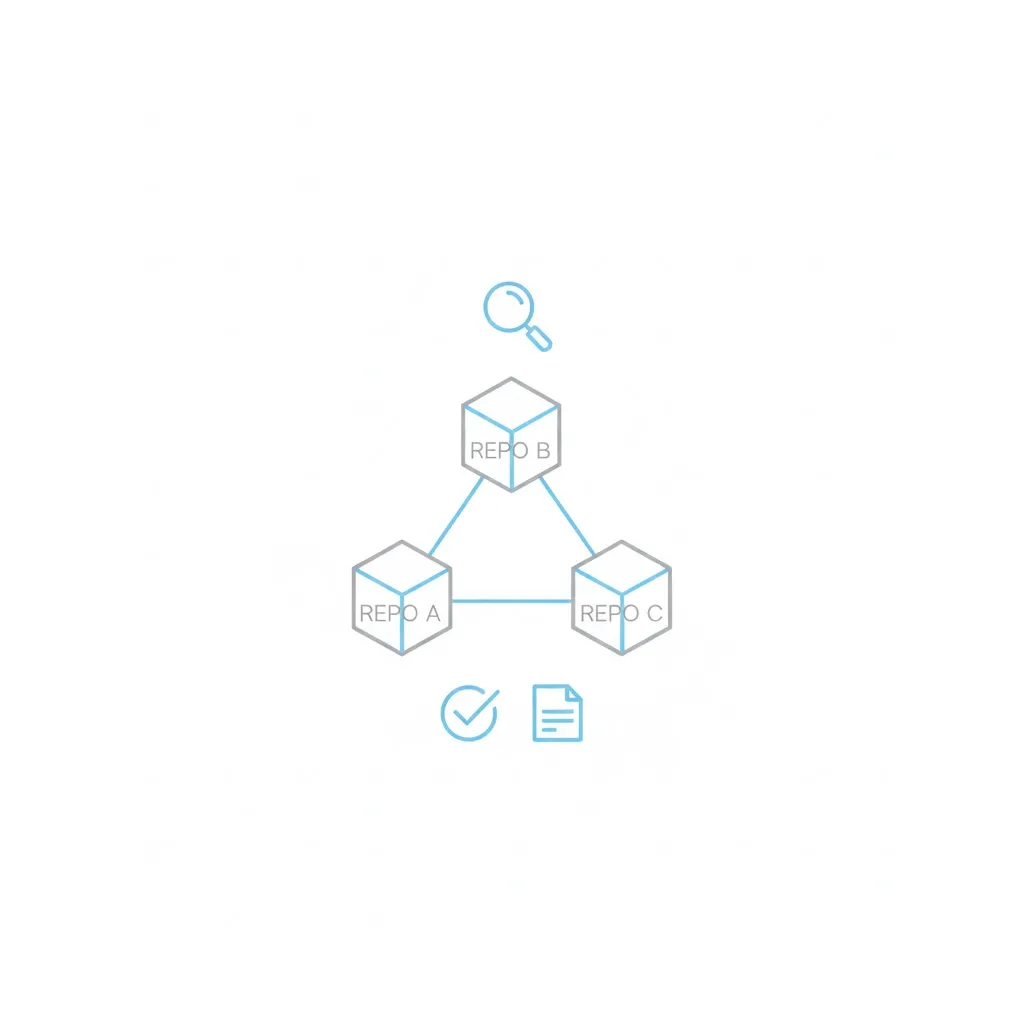
Here is the short story first. A high score on an isolated benchmark does not mean your system can find the right file across 25 repositories and then synthesize code that actually compiles. The real work is making sure retrieval, traversal, and generation all play nicely together when queries demand context from multiple repositories. That is the cross repository problem and it is the core keyword to optimize for in this post.
Why end to end evaluation matters for cross repository systems
What it is A full end to end evaluation measures the system from user query to final answer. That means retrieval, any graph traversal that connects repositories, reranking, and generation all get evaluated as a single flow.
Why it exists If retrieval misses a key file, the generator will invent plausible but wrong code. If the retriever is good but traversal picks poor neighbors, answers will reference the wrong API. End to end evaluation shows how these failures compound.
How it works You run the pipeline on a representative dataset. For each test case you store the oracle solution or the expected code paths. The pipeline runs retrieval metrics like Hit Rate and NDCG then runs generation checks such as groundedness and code execution pass rates. Finally you correlate errors across layers.
Real world example Imagine a bug fix that needs a database schema in repo A, an ORM helper in repo B, and a migration script in repo C. A successful end to end test must retrieve and surface those three anchors and then produce a change that compiles against those APIs.
Here is the tricky part. People often treat retrieval metrics and generation metrics separately. That is useful. But if you do not measure them together you will not know whether a poor system pass is a retrieval problem or a generation problem.
Orchestration code you can use
Below is an end to end evaluation orchestrator in Python. It is ready to plug into your existing GraphRAG system. The code runs retrieval and generation evaluations then produces a combined report and supports an ablation study to measure component contributions.
from typing import List, Dict
from dataclasses import dataclass
from datetime import datetime

# Minimal type structures for clarity
@dataclass
class EvaluationReport:
    retrieval: Dict
    generation: Dict
    metadata: Dict

@dataclass
class Insight:
    severity: str
    component: str
    finding: str
    recommendation: str

class GraphRAGEvaluationPipeline:
    """
    Orchestrate complete evaluation across all layers.
    """

    def __init__(self, graphrag_system, evaluation_dataset: List[Dict], config: Dict):
        self.system = graphrag_system
        self.dataset = evaluation_dataset
        self.config = config

        # Initialize evaluators that you must implement or inject
        self.retrieval_evaluator = GraphRAGRetrievalEvaluator(
            graphrag_retriever = graphrag_system.retriever,
            gold_dataset = evaluation_dataset,
            k_values = config.get("k_values", [5, 10, 20])
        )

        self.generation_evaluator = GraphRAGGenerationEvaluator(
            graphrag_system = graphrag_system,
            gold_dataset = evaluation_dataset,
            repository_mocks = config.get("repository_mocks", {})
        )

    def run_full_evaluation(self) -> EvaluationReport:
        """Run complete evaluation pipeline."""
        print("Evaluating retrieval layer...")
        retrieval_results = self.retrieval_evaluator.evaluate_all()

        print("Evaluating generation layer...")
        generation_results = self.generation_evaluator.evaluate_all()

        return EvaluationReport(
            retrieval = retrieval_results,
            generation = generation_results,
            metadata = {
                "dataset_size": len(self.dataset),
                "timestamp": datetime.now().isoformat(),
                "system_version": getattr(self.system, "version", "unknown")
            }
        )

    def run_ablation_study(self) -> Dict[str, EvaluationReport]:
        """
        Compare system variants to identify component contributions.
        """
        variants = {
            "full_system": self.system,
            "no_graph_traversal": self.system.without_graph(),
            "bm25_only": self.system.with_bm25_retrieval(),
            "dense_only": self.system.with_dense_retrieval(),
        }

        results = {}
        for name, variant in variants.items():
            print(f"Evaluating variant: {name}")
            pipeline = GraphRAGEvaluationPipeline(variant, self.dataset, self.config)
            results[name] = pipeline.run_full_evaluation()

        return results
Notes on wiring this into your infra
- The retrieval evaluator should return both aggregate metrics and per query type metrics
- The generation evaluator must be able to run code checks such as unit tests or lightweight execution
- repository_mocks is the place to provide reproducible code environment for generation tests
How to interpret the results
I will cover the key metrics and then give a short recipe for turning insights into work items.
NDCG explained
What it is
- Normalized Discounted Cumulative Gain or NDCG measures ranking quality. It rewards putting highly relevant documents near the top.
Why it matters for cross repository
- When queries require multi hop context, the most relevant file might not be in the first hit. NDCG captures whether the retriever ranks the right files early enough to be useful.
How it works
- You assign relevance scores to gold anchors. The ranked list from your retriever yields a discounted gain for each position. NDCG normalizes this by the ideal ranking so you can compare across queries.
Real world example
- If your retriever returns three files where one is the exact API definition and the others are related docs NDCG will score higher if the API definition appears in the top positions.
Cross repository precision
What it is
- Precision measured specifically for cross repository hits. It asks whether the set of returned documents spans the repositories required by the task.
Why it matters
- Many bugs need pieces from multiple repos. A high single repo hit rate means little if cross repository precision is low.
How it works
- Define the expected set of repositories per query. Compute the fraction of expected repositories present in the top K results.
Real world example
- If a query needs repos A B and C and the top K returns A and D your cross repository precision is 33% for that case.
Groundedness score
What it is A score that measures how explicitly the generator used retrieved context in its output.
Why it matters Generators can be fluent and still wrong. Groundedness measures whether claims in the output map back to retrieved anchors.
How it works Annotate spans in the generated text that should be supported by retrieved documents. Use a verifier model or a deterministic matcher to check whether those spans have corresponding evidence and compute a ratio.
Real world example A generated code snippet that references a function signature should include the same parameter names as the signature in the retrieved file. If it does not, groundedness is low.
Code execution pass rate
What it is Pass rate of generated code against tests or a sandboxed execution environment.
Why it matters This is the pragmatic check. If the generated patch fails to compile or fails tests it cannot be shipped.
How it works Run the snippet in a controlled environment or compile against the repository mocks and record whether it passes integration or unit tests. Use pass rate at position one to measure the top suggestion quality.
Real world example A 70% pass rate at top 1 means 7 out of 10 top suggestions execute or pass tests. Lower numbers indicate either missing context or generation logic problems.
Interpreting cross layer signals
Here are common patterns you will see and what they usually mean.
Good retrieval and low groundedness
What it signals
- Retriever finds relevant documents but the generator ignores them
Likely causes
- Prompting does not emphasize context
- Generator model selection is weak for grounding tasks
Fixes to try
- Add explicit citation instruction in the generation prompt
- Force the model to quote or reference top anchors
- Use a reranker to ensure the most salient spans are surfaced
Low retrieval and high groundedness
What it signals
- Generator works well when given the right context but the retriever is not finding it
Likely causes
- Graph edge weights or traversal stopping rules are too aggressive
- Embedding model is not tuned for your code base
Fixes to try
- Improve graph construction and edge typing
- Retrain embeddings on in domain code
- Add heuristics for multi hop traversal
Here is the tricky part. Nothing beats per query audit. Pick failures from each bucket and inspect top K anchors side by side with the generated output.
Results to include in your reports
Present data in a way your engineers can act on. Avoid long tables that hide patterns. Here is a compact CSV style snapshot you can paste into spreadsheets.
variant,ndcg@10,cross_repo_prec,groundedness,pass@1
full_system,0.712,0.540,0.820,0.710
no_graph_traversal,0.580,0.320,0.790,0.650
bm25_only,0.600,0.400,0.780,0.640
dense_only,0.660,0.480,0.800,0.670
Keep each metric paired with per query type breakdowns. For example provide ndcg@10 for single repository queries, for cross repository concept queries, and for dependency chain queries. You will spot patterns fast.
How to run an ablation study and what to look for
What it is
- An ablation study compares variants of your system to see which components move the needle.
Why it matters
- It isolates whether improvements come from the graph traversal, the reranker, or the generator.
How it works
- Create variants such as full system, graph removed, bm25 only, dense only. Run the same evaluation dataset on each variant. Compute deltas in NDCG and pass rates.
Real world example
- If removing graph traversal drops NDCG by 0.12 and pass rate by 0.06 you know the graph contributes significantly. If delta is small revisit graph construction and edge semantics.
Practical playbook to turn insights into work items
Prioritize by severity and frequency
- High severity items that appear in many queries get priority
Create small reproducible tasks
Example task
- Reproduce five failed cross repository queries locally
- Add targeted logging to gather which edges were traversed
- Test adjusted edge weights and measure NDCG change
Measure before and after
- Always re run the same evaluation harness to avoid noisy conclusions
Reporting template you can copy
Use this short template to communicate results to stakeholders. Keep it crisp and evidence driven.
Summary
- One sentence on system pass rate and the key bottleneck found
Metrics snapshot
- CSV style metrics block as above
Key findings
- Short bullets on component contributions and severity
Action items
- Concrete small experiments with owners and expected metrics to move
Sample comparison report generator
This helper converts ablation results into a readable report string. It is a minimal example you can expand.
def generate_comparison_report(ablation_results: Dict[str, EvaluationReport]) -> str:
    parts = ["# GraphRAG Evaluation Report Ablation Study\n"]
    parts.append("## Summary Metrics CSV\n")
    parts.append("variant,ndcg@10,cross_repo_prec,groundedness,pass@1\n")
    for name, result in ablation_results.items():
        ndcg = result.retrieval.get("overall_ndcg@10", 0)
        crp = result.retrieval.get("overall_cross_repo_precision", 0)
        ground = result.generation.get("avg_groundedness_score", 0)
        pass1 = result.generation.get("code_pass@1", 0)
        parts.append(f"{name},{ndcg:.3f},{crp:.3f},{ground:.3f},{pass1:.3f}\n")

    full = ablation_results.get("full_system")
    no_graph = ablation_results.get("no_graph_traversal")
    if full and no_graph:
        ndcg_delta = full.retrieval["overall_ndcg@10"] - no_graph.retrieval["overall_ndcg@10"]
        parts.append("\n## Graph Traversal Contribution\n")
        parts.append(f"NDCG@10 improvement from graph: {ndcg_delta:+.3f}\n")
        if ndcg_delta > 0.1:
            parts.append("Significant improvement noted from graph traversal\n")
        elif ndcg_delta > 0.05:
            parts.append("Moderate improvement noted from graph traversal\n")
        else:
            parts.append("Minimal improvement noted from graph traversal. Investigate graph construction\n")
    return "".join(parts)
Final notes on building trust with evaluation
- Focus on representative queries not synthetic easy cases
- Maintain a golden set of real cross repository incidents mined from your issue tracker
- Automate the evaluation run but review failures manually every release
This is where most setups break. Automated metrics tell you something is wrong. Manual audits tell you why. Pair both and your improvements will be targeted and measurable.